
Demonstrating Water Accounting and Water Productivity analyses to support Country Water Assessments
ADB WA Phase 1 (2017-2018)
Background
The concept of conducting country water assessments as a means to plan for improved national water security was suggested in the ADB Water Operational Plan 2011-2020. Subsequently, the Asia Water Development Outlook 2013 made a first attempt to quantify national water security, using five key dimensions: (i) household water security, (ii) economic water security, (iii) urban water security, (iv) environmental water security and (v) resilience to water related disasters. The Water Accounting+ activity and the associated trainings support in-country needs. Essential to the concept of the ADB country water assessments is the element of water demand forecasting, per economic sector (agriculture, industry, energy and municipal), vs. the surface water and groundwater resources for each (major) river basin. The approach was applied to 26 river basins in 5 countries.
The project also contributed to ADB agenda through its studies on crop water productivity (CWP) as water security is heavily underlined with irrigation water use in many Asian countries. “More crop per drop” will help ADB and its clients look at more efficient way of developing and managing the biggest water user – irrigation, and potentially, exploring possibility of building WP as diagnostic tool and monitoring indicator into ADB and country investment and management plans. The overall objective of this pilot and capacity building project is to help improve planning processes of the ADB investments in water security and irrigation systems, and enhance capacity to countries on the concepts of Crop Water Productivity. A CWP diagnosis of selected irrigation projects in 5 countries were implemented in order to increase the understanding on how to operationalise concepts of CWP under practical conditions in Asian developing countries.
Case studies
Water Accounting
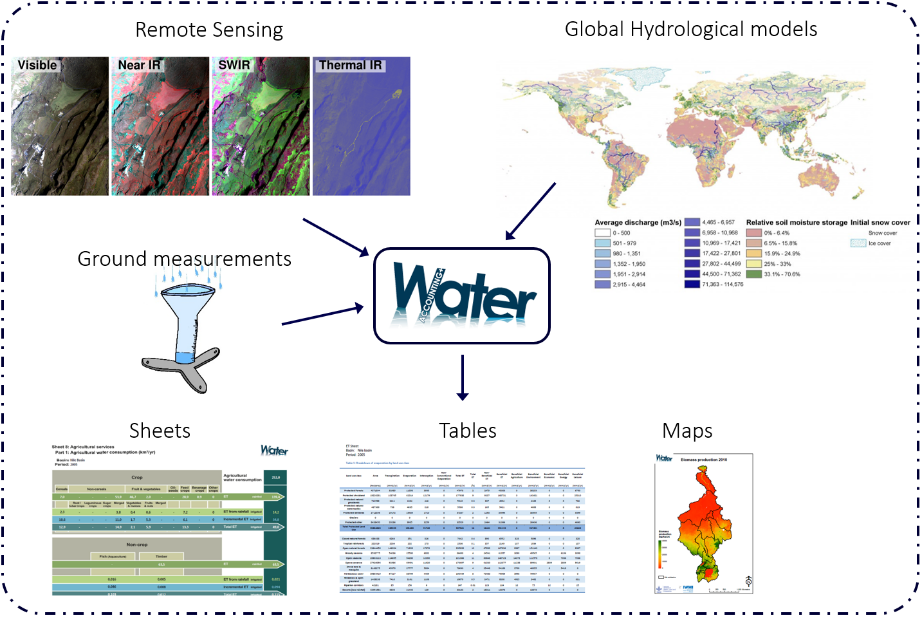 The main objective of the water accounting studies was to support the local recipient organizations and ADB activities in the selected areas in defining sustainable water management strategies by applying the WA+ procedure to estimate, available, exploitable, utilized and utilizable water resources. Monthly and yearly accounts are produced, with a spatial resolution of 250 m, for selected historic years for the period 2000-2014.
Cambodia
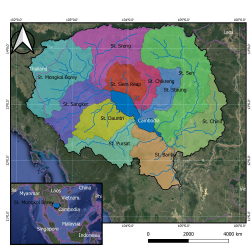 The water accounting study in Cambodia focused on the five River Basin Groups, which were analyzed for three historical years: a dry (2004), a wet (2007) and an average rainfall year (2008). The key results show that the Tonle Sap basin is currently experiencing the highest water stress (more than double than the other basins). All the Cambodian basins utilize less than 70% of the available water resources (on a yearly base). Cambodian basins are significantly dependent on upstream flow (from other basins or other countries). The Tonle Sap receives 20% of its net inflow form external sources (reverse flow and from Thailand), the Three S basin 42% from Vietnam, 88-99% for the Upper and Lower Mekong.
 India (Karnataka and madhya Pradesh)
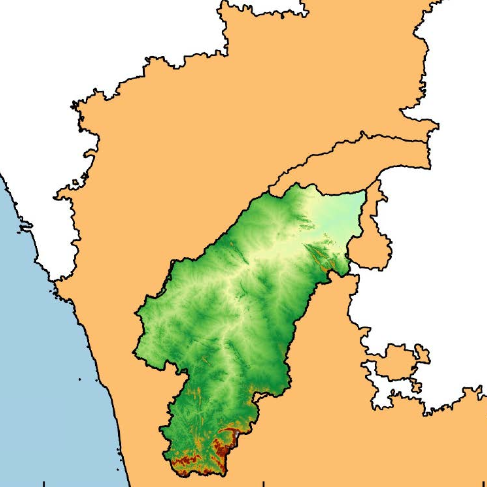
The water accounting studies in India focused on the Tungabhadra river basin in Karnataka and Kali Sindh and Wainganga river basins in Madhya Pradesh, which were analyzed for three historical years: a wet, dry year and average year. Some key results for the Tungabhadra are that on a yearly scale the Tugabhadra basin utilizes 50% - 80% of the available water leading to an average of 6.55 km3/yr of water that flows unutilized downstream. The utilizable outflow shows large fluctuations (the outflow during the dry year is only 27% of the outflow of a wet year). During dry months, the utilizable outflow is reduced to nearly 0 km3/yr.
In Madhya Pradesh a comparison was made between the two river basins, the Kali Sindh basin with an area of 3,771 km2 is relatively flat and consists of large alluvial flood plains. The Wainganga basin has an area of 18,397 km2 where the river Wainganga originates in the Mahadeo Hills and drains into the large floodplains located in the lower parts of the basin. Even on a yearly scale, the Kali Sindh basin has no utilizable water meaning that all the available water is already utilized. In addition, the basin is not able to meet its environmental flow requirements, and has high rates of non-recoverable flow (polluted water). Most of the blue water consumed in the Kali Sindh basin is due to human activity (mainly irrigation). On a yearly scale the Wainganga utilizes roughly 50% of the available water leading to an average of 8.5 km3/yr of water that flows unutilized downstream. However, during dry months, the utilizable out flow is reduced to nearly 0 km3/yr.
 Indonesia (Java and Sumatra)
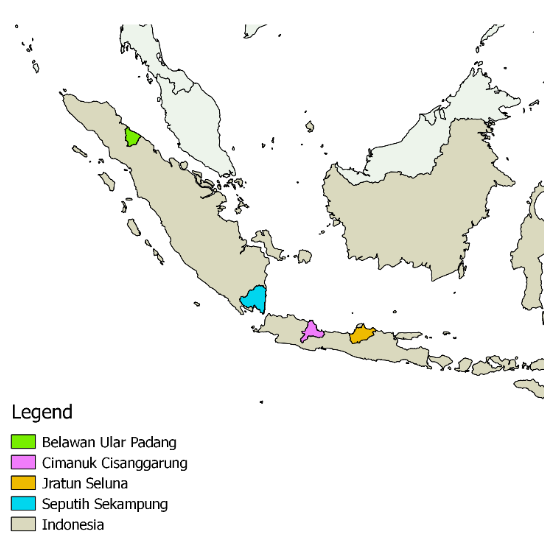
The water accounting plus framework was applied to 4 pilot basins in Indonesia: Seluna and Cimanuk Cisanggarung River Basins in Java Island; and Deli-Percut-Belawan and Seputih-Tulang Bawang river basins in Sumatra Island. For each basin, the results are presented for a wet, an average and a dry year selected from the period 2008-2014. The analyses show that on a basin and yearly scale, all four pilot basins were found to have sufficient water resources, but with very high variability of the seasonal water availability in particular for the Cimanuk, Jratunseluna and Seputih basin. Low water productivities indicate potential for increased production without additional water supply.
 Sri Lanka (Mahaweli)
The water accounting study in Sri Lanka was developed to support the formulation of the proposed Mahaweli Water Security Investment Program (MWSIP) with an independent assessment of water fluxes and consumption in the Mahaweli River Basin through the application of the WA+ procedure. On a basin and yearly scale, the Mahaweli was found to have sufficient water resources under current conditions. While the basin faces high intra and intra annual variability of the available water resources, current abstractions were found to be sustainable at the basin scale. However, water productivities were found to be low.
 Vietnam - (19 river basins)
The water account framework was applied to 16 Vietnamese basins for a period of 12 years. It provides an insight into the basins water balances of the years, the amounts of managed and manageable water and quantifying the utilizable and non-recoverable flows.
Water Productivity
 The gap between food production and food demand is increasing in many countries. One of the solutions is to produce the same amount of food from less water, or when feasible, produce more food from less water resources (or popular "more from less"). The key performance indicator to express this is the crop water productivity (or popular "more crop per drop"). Increasing crop water productivity (CWP) involves dual objectives of increasing crop yields and/or reducing crop water use. The analyses were implemented using remote sensing-based information to assess the current conditions, and to develop appropriate indicators to measure the performance of irrigation water management.
India (Karnataka and Madhya Pradesh)
 The water productivity studies in India focused on the Tungabhadra irrigation system in Karnataka and the Kundaliya Irrigation Project in Madhya Pradesh. The analyses in Tungabhadra irrigation system show that the CWP of rice in the Tungabhadra irrigation system is not low but with high spatial variability for the 2016 Kharif season. The average CWP of the TLBC is 1.44 kg/m3 with a CV of 13%. The average yield and ETa are 6.4 ton/ha and 448 mm respectively. The command areas of RBHL and RBLL has slightly higher CWP at 1.5 kg/m3 by using less water (437 mm) and producing higher yield (6.5 ton/ha). There was a shortage of 25 Mm3, or 3% of current consumption, for TLBC to satisfy full crop water requirement. However, this does have to come from additional supply. In fact, only 268 mm, or 60%, of total ETa is consumed through transpiration (Ta), meaning significant potential for improvement.
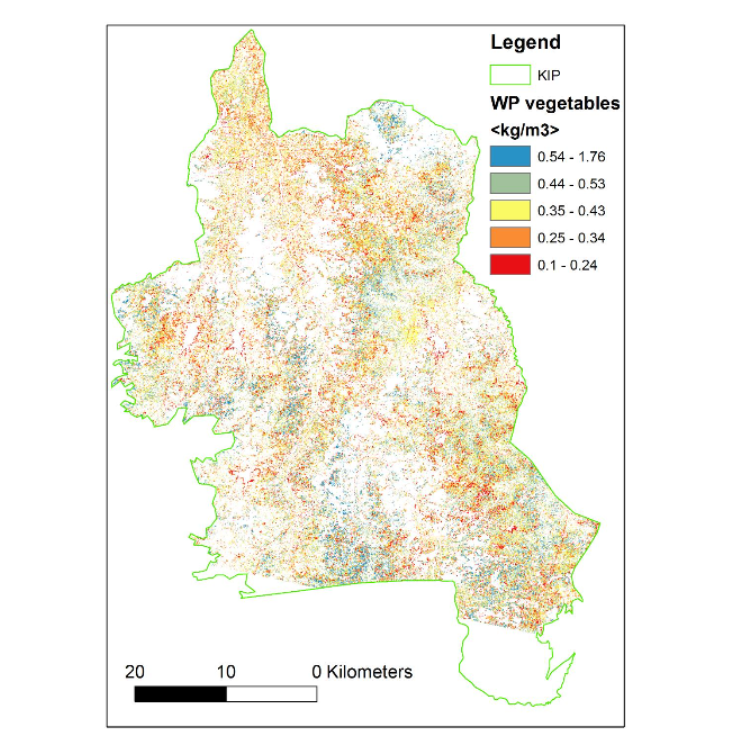
The CWP of wheat and vegetables were mapped in the KIP. The CWP of wheat is not low but with high spatial variability. The average CWP of wheat is 1.05 kg/m3 with a CV of 20%. The average yield and ETa are 3.8 ton/ha (CV 26%) and 369 mm (CV 21%) respectively. The average CWP of vegetables is 0.36 kg/m3 with a CV of 36%. The average yield and ETa of vegetables are 1.1 ton/ha (46%) and 318 (29%). Low CWP accompanied with very high variability indicates great potential not only at system level, but also among different areas within the system. High spatial variability represents non-uniform performance across the system. The crops are highly fragmented with small areas of cultivation spread out across the system for both wheat and vegetables. In general, the areas close to surface waterbodies have lower CWP but also low yields.
Indonesia
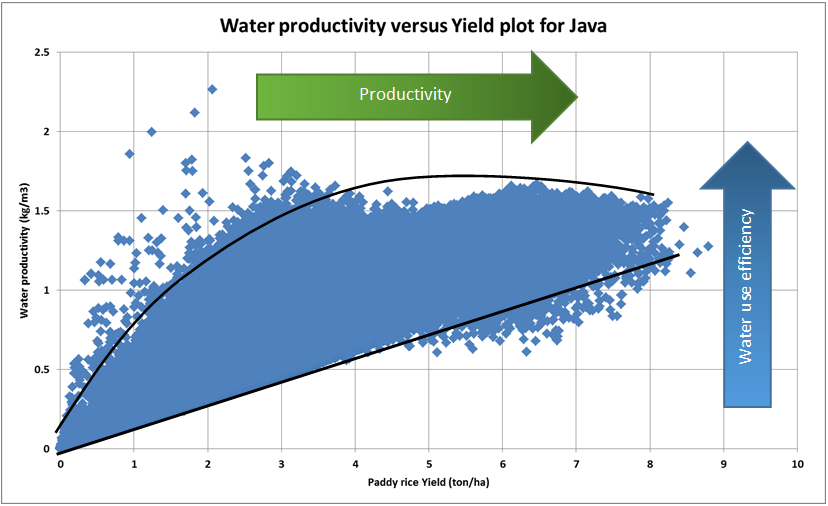
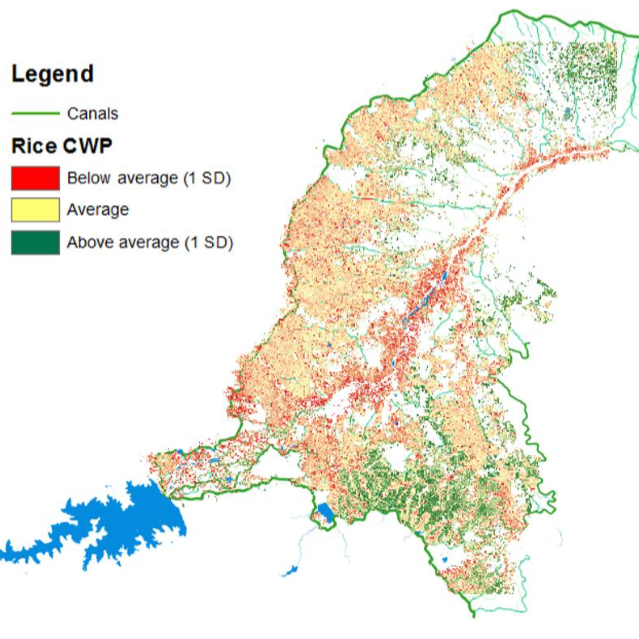
 The water productivity analyses in Indonesia focussed on the Rentang irrigation system in West Java, and the islands of Bali and Lombok. The results show that the average WP of paddy rice was 1.1, 0.76 and 1.4 kg/m3 for Bali, West Java and Lombok respectively, with high variability of CWP in all study sites. Compared to the world-wide average value for WP is 1.1 kg/m3, Bali represents the global average value, Lombok is higher and West Java is lower. The consumptive use (ETa) during the dry season was 506, 473 and 374 mm/season respectively. The paddy yield was 5.6, 3.6 and 5.0 ton/ha respectively. These case studies were combined with field visits which showed for example that in Bali a clear zone with predominantly WP values below average is found in the south-west of districts Badung and Tabanan. Factors that correlates with WP in Bali are drainage problems, erosion, poor water quality and three rice rotations per year.
Pakistan
 The water productivity analyses in Pakistan focused on the Lower Bari Doab Canal of the Punjab Irrigation Department. The results show that CWP of wheat is low with moderately high spatial variability. The average CWP of wheat is 0.89 kg/m3 with a CV of 13%. The average yield and ETa are 4.1 ton/ha (CV 15%) and 459 mm (CV 6%) respectively. The low WP is mainly attributed to high water consumption. High spatial variability represents non-uniform performance across the system, which represent great potential for farmers to learn from their better-performing neighbours. The overall potential is less in water management and more on non-water related yield factors, as indicated by the differences in CVs. No significant correlation was found between performance (water consumption, yield and CWP) among irrigation management units, or distance of farms to canals. The analysis did not find significant variations in CWP indicators among different administrative units, or head and tail end farms.
Sri Lanka
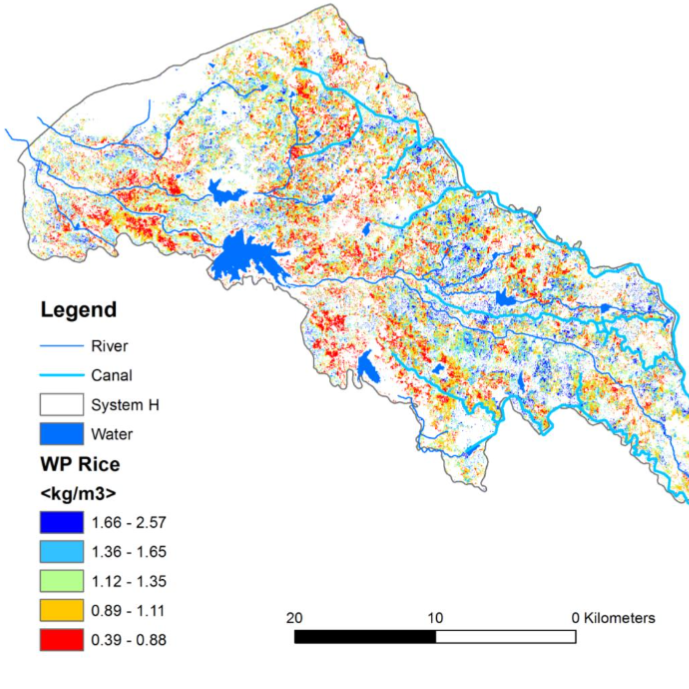 The water productivity analyses in Sri Lanka focused on system-H in the Mahaweli River Basin. The WP maps show poor and good irrigation management practices coincide in the system. The average WP of paddy rice was 1.15 kg/m3 for the 2016 Yala season, similar to that of the world-wide average value for WP at 1.1 kg/m3. The average rice yield was 5.1 t/ha and the average ETa was 452 mm. The spatially explicit maps also show variability and the scope for improvement. The coefficient of variations (CV) of WP, ETa, and yields are 27%, 31%, and 17% respectively. The variability is higher than recent studies in Indonesia, Vietnam, and India, indicating greater potential for improvement. High level of water shortage is found for the study area in 2016 Yala season. Average ET deficit is 156 mm for the entire growing season, which translate to a 26% shortage should the demand be fully met. Water scarcity is therefore the main constraint for improved food production of the system.
Vietnam
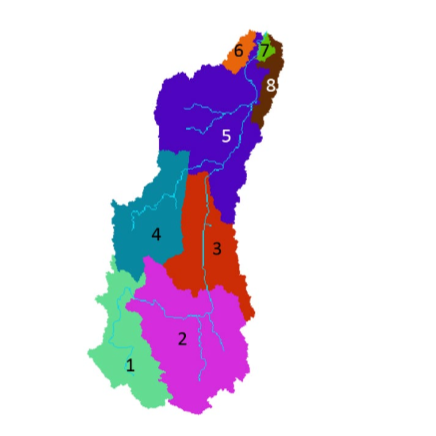
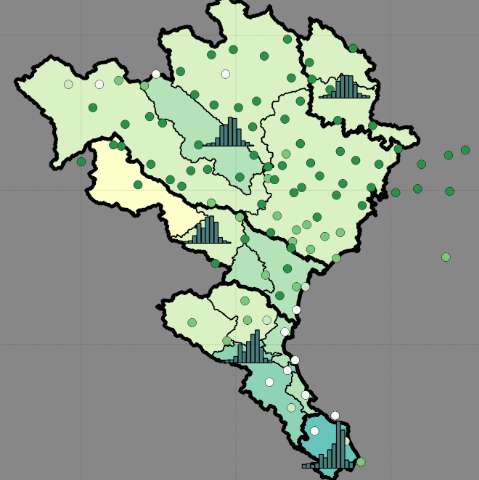
 The water productivity analyses in Vietnam focused on evaluating 9 irrigation schemes in the Central Highland and South Central Coastal regions of Vietnam. The data shows a wide variety of irrigation conditions. Mixed performance is observed for different crops with paddy rice having relatively high CWP at 1.37 kg/m3. Fruits have higher CWP ranging from 2.29-5.33 kg/m3, while coffee and pepper generally have low CWP at 0.13 and 0.16 kg/m3 respectively. However, when converted to monetary terms expressed in 2017 constant Vietnamese Dong (VND), The CWP of mango stands out at 110 thousand VND/m3, 15 times that of rice and 12 times that of coffee. Relatively high average coefficient of variation (standard deviation / mean value) on water productivity within a given crop ranges from 0.13 to 0.29. This implies that for most crops considerable savings in water consumption can be achieved (approximately 10 to 20%), together with increased productions (approximately 20 to 30 %). This number is based on the fact that local “hero farmers” were detected and that they have systematic higher land and water productivities as compared to the average performing farmer with the same type of crop and same agro-ecological zone. Hence it is practically feasible to get more food from less water.